CORRESP: A correspondence can be sent as a document with another submission type or can be sent as a separate submission.
Published on June 25, 2009

June 25, 2009
John Cash
Division of Corporation Finance
United States Securities and Exchange Commission
100 F Street, N.E.
Washington, DC 20549-7010
Mail Stop 3561
Division of Corporation Finance
United States Securities and Exchange Commission
100 F Street, N.E.
Washington, DC 20549-7010
Mail Stop 3561
RE:
|
Quanta Services, Inc. | |
| Form 10-K for the year ended December 31, 2007 | ||
| Definitive Proxy Statement, April 18, 2008 | ||
| Form 10-Q for the quarter ended September 30, 2008 | ||
| File No. 1-13831 |
Dear Mr. Cash:
We are providing the following response to the comment letter dated May 26, 2009 from the
staff (the Staff) of the Securities and Exchange Commission (the Commission) regarding the Form
10-K for the year ended December 31, 2007, the Definitive Proxy Statement dated April 18, 2008 and
the Form 10-Q for the quarter ended September 30, 2008 filed by Quanta Services, Inc. (Quanta or
the Company). The following response is keyed to the Staffs comment, and unless otherwise
stated, all page numbers in our response refer to the respective page numbers in the relevant
filing. For purposes of this letter, references to Quantas operating units are intended to mean
those 25 operating segments that comprise Quantas Infrastructure Services segment. This response
has been prepared with the expectation that the Company will have the opportunity to discuss with
the Staff information submitted in this response if, following a review of the information, the
Staff has further questions or comments.
Form 10-Q for the period ended September 30, 2008
Notes to the Condensed Consolidated Financial Statements
Note 9. Segment Information, page 25
| 1. | We have reviewed your response to our previous comment in our letter dated February 2, 2009 and appreciate the additional information you have provided. However, it continues to appear to us that you have not fully demonstrated how you determined it was appropriate to aggregate the 25 operating units that comprise your Infrastructure Services reportable segment. Therefore, please address the following items: |
1
| | Please clarify for us what measures or group of measures is used by your CODM to evaluate the economic performance of your operating segments. In addition, please provide us with an analysis of these measures for each quarter in the past two fiscal years as well as the most recent interim period with an explanation of how you have considered the similarities and differences in these measures when determining it was appropriate to aggregate your operating segments. |
Response:
The primary measures that are used by Quantas CODM to evaluate the performance of Quantas
operating units are monthly, quarterly and year-to-date revenues, gross profit and operating income
by operating unit and detailed analyses of revenue and gross profit by project at each operating
unit for the applicable reporting period. Each operating unit performs and provides to Quanta a
project-by-project analysis describing the various items impacting project performance for the
period and their effect on billed and unbilled revenue, project costs incurred and estimated to be
incurred and overall project profitability compared to previous expectations. As reflected in our
January 9, 2009 response letter to the Staff, we have previously provided to the Staff, under a
confidential treatment request, various reports provided to Quantas CODM labeled Category A,
including a July 2008 example of the monthly CODM package, which evidences that a significant
amount of the information included within Quantas CODM package is this type of project level data.
This information provides managements basis for understanding the overall performance of each
operating unit and its variations from expectations for the applicable reporting period. We note
for the Staff that the monthly CODM package does not include aggregated information by type of work
or geographic location, and also does not include any measures of operating income by project, or
of EBITDA either by operating unit, by geographic location, by project or by type of work, or any
other data that might indicate that a different methodology currently exists for managing Quantas
operations other than that currently used for analysis of results by operating unit.
The project-by-project performance measures of revenues and gross profit are key to managements
analysis of each operating units performance in any given reporting period and we note that
examples of this information are included in the examples of Quantas CODM packages that were
previously provided to the Staff on a confidential basis in our January 9, 2009 response to the
Staff. However, for purposes of responding to the Staffs request for additional information
regarding managements analysis of performance measures, we believe that such project level
information for each quarter in the past two fiscal years and the most recent interim period would
be too voluminous (e.g., it would present information covering thousands of projects) to provide to
the Staff. In response to the Staffs request, we have prepared a summary schedule of each of the
measures of revenue, gross profit and operating income by operating unit for each quarter in the
past two fiscal years and the most recent interim period, which we have
2
provided as Attachment A to the Staff supplementally by hand delivery and under separate cover,
pursuant to a confidential treatment request under the Freedom of Information Act and applicable
regulations of the Commission (the Confidential Treatment Request). Further, we have also
provided to the Staff an analysis of these performance measures in the detailed discussion in
Attachment B to this letter.
The information provided supplementally as Attachment A and the discussion included in Attachment B
illustrates the substantial variability in gross margins and operating income margins that
routinely occurs at the operating unit level. In addition, it illustrates that the variability
occurs between reporting periods for the same operating unit, among operating units that have
similar mixes of services and between operating units with different mixes of services. These
variations also exist whether analyzing margins over sequential periods or on a year-over-year
basis. This variability is a function of the project-by-project nature of the services that each
of Quantas operating units provide.
The analyses described in Attachment B are not exhaustive, and their relevance is not limited to
the discussion presented. However, we do believe they provide representative examples of the
variability that exists among all operating units, by type of work and in period-to-period
comparisons. These examples also support the conclusions reached in considering the similarities
and differences in these measures when determining it was appropriate to aggregate Quantas
operating segments and why we believe that Quantas current enterprise-wide disclosure of revenues
by type of work enhance the financial statement users understanding. We believe that the analyses
in Attachment B illustrate that the fundamental similarities underlying Quantas operating units
cannot be measured in a simplistic comparison of operating margins. Such an approach would not
lend itself to consideration of the more relevant economic characteristic that is similar across
all operating units, which is the project-by-project performance risk at each of Quantas operating
units. Inherent to each project within the specialty contracting industry is a unique set of
performance risks which are associated with, among other things, the complexity of the individual
project requirements, the location and physical conditions of the project site, the need to
coordinate with other contractors, the labor pool involved, the risks of customer outages, the use
of subcontractors, right-of-way requirements, permitting and licensing requirements, the level of
customer change orders, production time frames and completion deadlines as well as the capabilities
of the individual project management teams. These types of project-specific performance risks
represent the similar economic characteristics associated with Quantas specialty contracting
services that management considers in evaluating Quantas operating units for aggregation.
| | Please further explain the statement contained in your response letter dated December 11, 2008 that, in determining that it was appropriate to aggregate the 25 operating segments into your Infrastructure Services reportable segment, you concluded that the economic characteristics will be similar over the long-term in the sense that they are expected to vary. |
3
Response:
We note the full statement made in our previous letter was as follows: Accordingly, Quanta
anticipates that its operating units economic characteristics will be similar over the long-term
in the sense that they are expected to vary among the operating units and between periods due to
the nature of the work performed.
The context of this statement was closure to a point discussing that the similarity in long-term
average gross margins is an important factor for aggregation. In this discussion, we noted that
similarity of gross margins has frequently been discussed as being within 5% or 10%. The
statement the Staff refers to was included to illustrate that pricing and production risk are
inherent to Quantas industry due to the project-by-project nature of Quantas work and that the
narrow definition of this economic characteristic was not meaningful in Quantas case due to the
significant fluctuations in margins that frequently result from these risks. The intention of this
statement in our previous response was to succinctly convey the same conclusion that is discussed
under the response included in this letter to the first bullet point of the Staffs comment: that
the project-level risk among all operating units is what creates the similar economic
characteristic associated with margins, which is also what is expected to be similar in both the
near-term and long-term for Quantas operating units.
| | Tell us how the geographic location of the operating units impacts the results of the operating unit by addressing the location of each unit, the impact that the difference in local labor costs may have on your units and the impact of the region on your revenue stream. |
Response:
The geographic location of the operating unit itself does not impact the revenue stream or the
results of the operating unit. As discussed in the above responses, an operating units results
are impacted by the performance and associated risk on each of its individual projects. The aspect
of the geographic location that impacts the projects is not the geographic region within the United
States where each unit is located, but rather the geographic characteristics associated with the
physical location where the work is being performed. Such characteristics include urban versus
rural settings, mountainous versus open terrain, rock versus dirt, or even a locations
susceptibility to inclement weather. These types of geographic factors are evaluated as a part of
the overall risk that may impact project productivity, which are then considered when pricing the
work to be performed. However, their impacts on productivity vary from project to project, and
therefore the margins on projects can vary significantly due to the inherent risks of performance,
including risks associated with specific locations.
Additionally, in response to the Staffs request, we have provided to the Staff a listing of the
location of each of Quantas operating units in Attachment C. This listing indicates the
location of each of the corporate offices of the operating units, which has minimal correlation
with where the contracted work is actually performed by that operating unit.
4
In addition, we have indicated each of the operating units operating locations, some of which may
be used for project-specific purposes. As noted in the listing, most of Quantas operating units
have multiple offices and many of them have a presence in numerous states. Many of these offices
overlap the geographic areas of operation for other operating units. To further illustrate how the
geographic location of each operating unit does not impact the results of an operating unit, we
note that all but one of Quantas operating units performed work in multiple states during 2008.
Of the total number of operating units, seven performed work in over twenty states and fifteen
performed work in over ten states. Many of those operating units that performed services in less
than ten states performed a significant amount of work across a broad geographic area. For
example, one operating unit whose corporate office is located in Colorado performed work in five
states: Colorado, California, Nevada, Massachusetts and Rhode Island. Another operating unit whose
corporate office is located in California performed work in six states: California, Florida,
Maryland, New Mexico, Nevada and Texas.
Regarding the Staffs inquiry about the impact that the difference in local labor costs may have on
operating units, Quanta does have variable labor costs that may be impacted by the geographic
location of the work. However, factors other than the geographic location of the work also impact
labor costs such as the mix of skill levels required for a particular project. None of these
factors directly impact the margins for the work that Quanta performs. Numerous factors are
considered when deriving the pricing for a particular project such as equipment, subcontractors,
and materials, with labor costs being just one of the many factors considered when deriving the
costs and risks associated with performing a particular type of project. Local operating unit
management considers all such factors, along with customer expectations, to determine the pricing
for each project.
We note for the Staff that financial information is not aggregated by geographic region on a
regular basis by Quanta, and it is not provided to the CODM or any other level of management for
the purpose of allocating resources or managing Quantas operations. We believe that the above
analysis supports Quantas aggregation considerations in that it indicates how the management of
Quantas organization by some defined geographic region is not supportable as each operating unit
functions independently and throughout numerous geographic areas.
| | Provide us with a quantified discussion regarding the degree to which your operating units earn revenue across industry lines. It appears that each of your operating units is concentrated in one predominant industry. |
Response:
As discussed in detail in our response letter to the Staff dated April 20, 2009, Quanta considers
that all of its operating units operate in one industry, which is the specialty contracting service
industry. However, given the Staffs comment, we presume that the Staffs reference to industry
means a specific type of work or the industry in which
5
Quantas customers operate. Under that assumption, we respectfully disagree that each of
[Quantas] operating units is concentrated in one predominant industry. Nineteen of Quantas 25
operating units aggregated within the Infrastructure Services segment routinely report revenues
from multiple types of work. However, to address the Staffs comment under the expressed
assumption, the following discussion focuses on the types of work or contracting services that
Quanta provides to its customers in different industries. Quanta agrees that certain operating
units earn a majority of their revenues from one type of work; however, numerous operating units
exist that have large amounts of revenues from multiple types of work other than the predominant
type of work, which precludes the meaningful segregation of the operating units on the basis of
their predominant type of work. For purposes of this discussion, predominant is defined as
revenues greater than 50% being derived from a particular type of work.
In Attachment D to this letter, we have provided to the Staff a detailed analysis of the different
types of work performed by Quanta and the impacts and difficulties of segregating Quantas
operating units based on the predominance of one type of work verses another.
Although the analysis at Attachment D is focused on data for the twelve months ended December 31,
2008, we note that such an analysis is representative of other periods. In particular, as
reflected in the discussion in Attachment E, various periodic reorganizations result in a shift in
the predominant type of work performed by certain of Quantas operating units. In considering
these reorganizations from an aggregation standpoint, Quanta believes that these potentially
regular retroactive restatements of previous years data resulting from these reorganizations would
make its usefulness inconsistent with paragraph 3 of SFAS 131, which sets forth the objectives of
segment reporting.
Quanta believes the analysis provided in Attachment D illustrates that significant amounts of
revenues are derived from multiple types of work for multiple operating units. This analysis
supports the fact that aggregations of Quantas operating units on the basis of their predominant type of
work would result in the inclusion of significant amounts of unrelated revenues, gross profit and
operating income in each type of work category, as well as result in probable reclassifications of
operating segments from one reporting segment to another on a period-to-period basis due to
changes in their mix of type of work, illustrating how a simplified approach to aggregation by type
of work creates data that, if presented, would not be meaningful or comparable on a
period-to-period basis. In addition, the analysis in Attachment D illustrates the specialty
contractor services business model and why management evaluates
performance and makes decisions at the operating unit or project level rather than by type of work.
| | Provide us with a more detailed explanation of how your Company bids on contracts. Tell us if the bidding is done at the operating unit level or at the corporate level. If the bidding is done at the operating unit level, tell us whether multiple operating units may compete |
6
| against each other for bids. If the bidding is done at the corporate level, please explain to us how the contracts are allocated to the operating units. |
Response:
Bids are developed at the operating unit level with Quantas operating units often competing
against each other for the work being bid. Bids are developed by project estimators at each
operating unit who consider, among other things, the type of work to be performed, the complexity
of the project requirements, the location and physical conditions of the project site, the need to
coordinate with other contractors, the labor pool involved, the risks of customer outages, the use
of subcontractors, right-of-way requirements, and the time frame in which the project must be
completed. Once the bid is prepared and depending on the size of the project, the bid is reviewed
through different management layers of the operating unit, and for certain jobs, at the corporate
level by a division president and/or Quantas chief executive officer, who, as noted in our
December 11, 2008 response letter, is also Quantas CODM. These varying levels of review that are
required reflect the varying complexities for each contracted project and the project-by-project
risks that are managed across Quantas organization.
| | Tell us how you account for revenues and expenses at the operating unit level if support from one operating unit is lent to another. For example, please explain whether the revenue and costs remain with the original operating unit or transfers to the unit which was borrowed from. |
Response:
When one operating unit works for another operating unit, the typical methodology used is a
subcontract relationship with the subcontracted operating unit recording revenues and profits for
its portion of the services through intercompany billings to the prime contracting operating unit.
The prime contracting operating unit records these intercompany
subcontracted services as a direct cost.
These intercompany transactions are eliminated through consolidation.
| | Provide us with a more specific and comprehensive discussion regarding the degree and frequency of the interchangeability of your labor. We note from your letter dated April 20, 2009 that individuals can be utilized on portions of work in other industries. It therefore appears that there may be limits on the interchangeability of your labor based on skill sets of the individuals. |
7
Response:
A substantial number of Quantas projects share fundamental skills such as directional drilling,
trenching, pole setting, road building, site preparation, foundations and assembly. Much of this
work does not require specialized labor skills. Regarding the degree and frequency of the
interchangeability of Quantas labor, labor is utilized across types of work on a regular and
recurring basis. We refer the Staff to Attachment E to this letter, which provides a detailed
discussion of examples of resource allocation decisions that Quanta believes provide strong
evidence to support its views regarding the interchangeability of Quantas labor. All of the
examples discussed in Attachment E are recent and have occurred during the time period with which
we have been corresponding with the Staff regarding Quantas segment reporting. As discussed,
these examples include not only the personnel performing the day-to-day tasks on the projects, but
also the project management personnel and upper level management.
We concur with the Staffs comment that there are limits on the interchangeability of Quantas
labor based on skill sets of certain individuals, as various services Quanta provides are highly
technical and sometimes uniquely risky. However, we do not believe that these limits to absolute
and full interchangeability inhibit the manageability of the majority of Quantas workforce across
service lines. For example, various individuals may be trained for various different specialties,
despite the fact that these individuals may also provide services within the same type of work.
Although not exhaustive, we believe the above discussion and the discussion in Attachment E reflect
numerous examples of interchangeability of Quantas personnel, as well as further illustrate the
similar economic characteristics of the project work being performed. Without these similarities,
the ability to interchange labor and management would be greatly diminished. In addition, we
believe that the discussion provides further evidence as to why executive management reviews and
manages Quantas results on an operating unit-by-operating unit basis and not on any other basis,
such as by type of work or geographically. This management methodology supports the aggregation of
the 25 operating units into the Infrastructure Services segment and indicates how the presentation
of information in any other capacity may not be meaningful or comparable period-to-period.
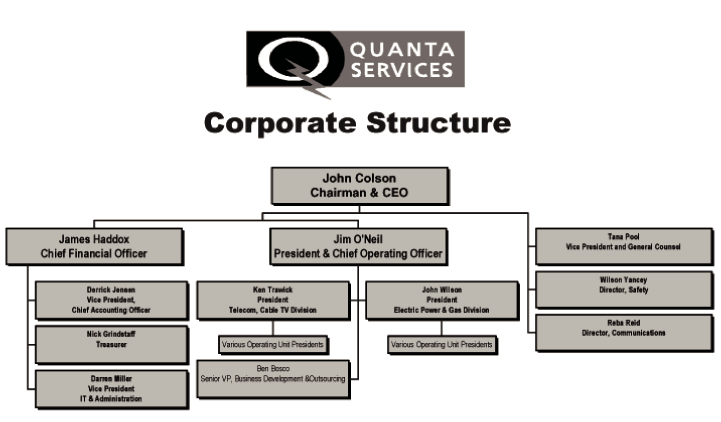
| | Please provide to us your most recent organization chart. |
Response:
See Attachment F to this letter.
| | We note the reports you have provided to us. Please tell us what level of detail is provided to your board of directors. |
8
Response:
The detailed information provided to Quantas Board of Directors sets forth quarterly measures of
revenue, gross profit and operating income by operating unit based on actual results, forecasted
performance and budgeted performance. For operating units with material variations from forecast,
a discussion is provided that describes the individual project circumstances that caused these
variances. No type of work data or data based on geographic region is provided to Quantas Board
of Directors. This material is consistent with the discussion in this letter above and in
Attachment B regarding managements analysis of operating unit performance and the
project-by-project nature of work being performed. In addition to the detailed information
described above, Quantas Board of Directors is provided with summary level information of Quantas
divisional reporting groups, similar to the information in our example
monthly CODM package for July 2008 provided supplementally to
the Staff in connection with our January 9, 2009 response letter.
The information provided to the Board of Directors also
includes a general economic discussion and non-financial
analysis of the industries in which Quantas customers operate,
similar to the information described in the Management Discussion and Analysis and Outlook sections
of Quantas Form 10-K and Forms 10-Q. Therefore, Quanta believes that the level of financial
information and analysis provided to its Board of Directors is comparable to the disclosures made
throughout its periodic filings which provides strong evidence to support the appropriateness of
the current level of disclosure made by management with regard to Quantas performance and expected
future net cash flows.
*****
We acknowledge that the subject matter of this letter and its related attachments, including the
attachment provided supplementally under the Confidential Treatment Request, contain many
conclusions reached based on an analysis of detailed financial information and internal assessments
of Quantas operations, and that communication of such matters can often be more effectively
facilitated through an interactive dialogue. We respectfully request that the Staff allow us an
opportunity to discuss this response letter further with the Staff if, following a review of this
information, the Staff does not concur with our views. If you have further questions or comments,
or if you require additional information, please contact the undersigned by telephone at (713)
985-6406 or by facsimile at (713) 629-7676.
| Very truly yours, |
||||
| /s/ James H. Haddox | ||||
| James H. Haddox | ||||
| Chief Financial Officer | ||||
cc:
|
James R. Ball | |
| Chairman, Audit Committee | ||
9
| Mindy Hooker, Staff Accountant | ||
| Tricia Armelin, Senior Staff Accountant | ||
| Division of Corporation Finance | ||
| Securities and Exchange Commission | ||
| Kenneth Miller, National Professional Services Partner | ||
| Ray Garcia, Houston Market Assurance Leader | ||
| David Carroway, Assurance Partner | ||
| PricewaterhouseCoopers LLP |
10
Attachment B
Discussion of Variability in Quantas Operating Unit Operating Income Margins
Discussion of Variability in Quantas Operating Unit Operating Income Margins
In response to the Staffs request in the first bullet point in its letter dated May 26, 2009, we
have prepared a summary schedule of each of the measures of revenue, gross profit and operating
income before amortization of intangible assets by operating unit for each quarter in the past two
fiscal years and the most recent interim period and presented this information in the Attachment A
provided supplementally under the Confidential Treatment Request. The information presented in the
Attachment A provided supplementally is pro forma, predominantly due to the significant acquisition
of InfraSource Services, Inc. in September 2007, so as to provide a more meaningful analysis of
Quantas operating unit performance measures. The discussion below provides a detailed analysis of
these performance measures and a discussion of certain examples of the variability that exists
among all operating units and among Quantas different types of work on a period-to-period basis.
We believe that these representative examples of the variability that is inherent in all of
Quantas infrastructure services operating segments, as well as in the types of work performed by
the operating segments, support the conclusions reached in considering the similarities and
differences in these measures when determining it is appropriate to aggregate Quantas operating
segments into the Infrastructure Services segment.
The following table, which is derived from the information presented in Attachment A provided
supplementally, excludes consideration of the results of one of Quantas operating units whose
results are considered to be insignificant. Additionally, the table below does not consider the
results of certain other Quanta operating units in deriving the lowest operating income margin
percentages for the quarterly periods ended June 30, 2008, September 30, 2008 and December 31, 2008
because these specific operating units reported margins which are
considered to be anomalous.
Analysis of Variability in Operating Income Margins Across Operating Units:
Operating Income Percentages of Certain Operating Units
| Next | Next | |||||||||||||||
| Qtrly Period | Highest | Lowest | Highest | Lowest | ||||||||||||
03/31/07 |
16.4 | % | -19.4 | % | 12.6 | % | -7.5 | % | ||||||||
06/30/07 |
14.6 | % | -21.9 | % | 13.7 | % | -5.1 | % | ||||||||
09/30/07 |
21.5 | % | -3.6 | % | 16.2 | % | 2.0 | % | ||||||||
12/31/07 |
22.1 | % | -12.9 | % | 18.4 | % | -12.2 | % | ||||||||
03/31/08 |
19.1 | % | -11.2 | % | 15.1 | % | 0.6 | % | ||||||||
06/30/08 |
19.5 | % | -15.5 | % | 18.2 | % | -10.9 | % | ||||||||
09/30/08 |
20.9 | % | -8.0 | % | 19.8 | % | 2.8 | % | ||||||||
12/31/08 |
24.7 | % | -52.1 | % | 22.1 | % | -15.6 | % | ||||||||
03/31/09 |
26.7 | % | -42.1 | % | 12.0 | % | -28.1 | % | ||||||||
The above table illustrates the variability of operating income margins between the requested
quarterly periods. It highlights the highest and lowest operating income margin for each period as
well as the next highest and lowest operating income margin for those periods. It is important
Page 1
to note that each of the data points above are typically representative of a different operating
unit in each period (this table contains data from 18 operating units).
To further illustrate that variability in operating margins is not directly related to the size of
an operating unit or its mix of type of work, the following table of operating income margins has
been prepared from the data in Attachment A provided supplementally using three individual
operating units for which contracting services for electric power projects comprise a substantial
portion of their revenues. This table summarizes operating income margins by period for one
operating unit that currently provides only contracting services for electric power projects, as
well as information from two of Quantas largest operating units that provide contracting services
for electric power projects on a predominant basis, with predominant meaning greater than 50% of
total revenues for purposes of this discussion.
Operating Income Percentages by Operating Unit
| Qtrly Period | Unit A | Unit B | Unit C | |||||||||
03/31/07 |
16.4 | % | 10.5 | % | 9.9 | % | ||||||
06/30/07 |
6.9 | % | 10.5 | % | 10.5 | % | ||||||
09/30/07 |
4.7 | % | 13.8 | % | 7.3 | % | ||||||
12/31/07 |
16.1 | % | 6.0 | % | 11.8 | % | ||||||
03/31/08 |
5.6 | % | 9.8 | % | 11.5 | % | ||||||
06/30/08 |
7.1 | % | 15.3 | % | 12.6 | % | ||||||
09/30/08 |
20.9 | % | 13.2 | % | 12.6 | % | ||||||
12/31/08 |
14.4 | % | 14.4 | % | 10.3 | % | ||||||
03/31/09 |
26.7 | % | 8.1 | % | 12.0 | % | ||||||
For the above analysis, the distinguishing facts are that the data represents a mid-size operating
unit that derives all of its revenues from only contracting services for electric power projects
(Unit A), as well as data for the two largest operating units of Quanta which both derive the
predominant amount of their revenues from contracting services for electric power projects. The
variability of margins among these operating units individually is substantial and is indicative of
similar type analysis among other predominantly similar operating units. Unit As operating income
margins range from a low of 4.7% to a high of 26.7%; Unit Bs margins range from a low of 6.0% to a
high of 15.3%; and Unit Cs margins range from a low of 7.3% to a high of 12.6%.
Unit A and Unit B have the most similarity regarding the type of services provided, as 100% of Unit
As revenues are derived from contracting services for electric power projects and more than 90% of
Unit Bs revenues are typically derived from contracting services for electric power projects.
However, Quanta notes that the operating income margin differences between Unit A and Unit B
fluctuate substantially in all but one of the periods highlighted above.
Unit C is one of the largest operating units of Quanta, and it also derives the predominant amount
of its revenues from contracting services for electric power projects. When comparing Units B and
C, there is slightly less variability in margins noted between these two units on a period-to-
Page 2
period basis. The fact that Unit C has less variability when compared to Unit B than when
comparing margins for Unit A to Unit B is particularly important to
note since despite the fact
that both Unit B and Unit C derive the predominant amount of their revenues from electric power
services, Unit C derived 26.0%, 40.2%, and 15.5% of its revenues from gas projects in 2007, 2008
and the first quarter of 2009, respectively. Therefore, the operating unit with the more diverse
revenue mix (Unit C) actually has more similar margins to Quantas largest provider of contracting
services for electric power projects (Unit B) than the other operating unit which provides
contracting services for electric power projects exclusively.
No Correlation between Predominant Contracting Services for Electric Power Projects and
Comparability of Year-to-Date Operating Income Margins Among Operating Units:
| | For the year-to-date 2007 period, from those operating units that derived the predominant amount of revenues from contracting services for electric power projects, the lowest operating income margin was 3.3% and the highest operating income margin was 12.5%. | ||
| | For the year-to-date 2008 period, from those operating units that derived the predominant amount of revenues from contracting services for electric power projects, the lowest operating income margin was 2.5% and the highest operating income margin was 13.2%. |
As a supporting factor in our consideration of this data, we again note that these compared results
were achieved by different operating units in each period discussed. For example, the operating
unit with the highest operating income margin in 2007 was the operating unit with the lowest
operating income margin in 2008. Additionally, the operating unit with the lowest operating income
margin in 2007 had an operating income margin of 7.8% in 2008, an increase of 136% year-over-year.
When comparing 2007 versus 2008, every operating unit that derived the predominant amount of
revenues from contracting services for electric power projects had differences in operating income
of greater than 10% year-over-year.
No Correlation between Predominant Contracting Services for Telecommunication Projects and
Comparability of Year-to-Date Operating Income Margins Among Operating Units:
For those operating units that derived the predominant amount of revenues from contracting services
for telecommunication projects, the lowest operating income margin for the year-to-date 2007 period
was 2.3% and the highest operating income margin was 15.7%. In those same operating units in the
year-to-date 2008 period, the lowest operating income margin was 1.2% and the highest operating
income margin was 16.6%. The operating unit that had the highest margin in 2007 reported an
operating income margin in 2008 of 13.0%, a decrease of 17.2%.
Page 3
Quanta Services, Inc.
|
Attachment C | |
Facility Locations |
BLAIR PARK/SUNESYS
| Division | City | State | ||
Main Office
|
Warrington | PA | ||
Field Office
|
Corona | CA | ||
Field Office
|
Oakbrook Terrace | IL | ||
Field Office
|
San Jose | CA | ||
Field Office
|
McMurray | PA | ||
Field Office
|
West Mifflin | PA |
H.L. CHAPMAN COMPANIES
| Division | City | State | ||
Main Office/ Austin Trencher/ Sullivan Welding
|
Leander | TX | ||
Field Office
|
Bulverde | TX | ||
Field Office
|
Florence | TX |
DILLARD SMITH CONSTRUCTION COMPANY
| Division | City | State | ||
Main Office
|
Chattanooga | TN | ||
Alabama Region
|
Clanton | AL | ||
Florida Region
|
Okahumpka | FL | ||
Georgia Region/ Quanta Utility Gulf States
|
College Park | GA | ||
KY/VA/WV/Carolinas
|
Monroe | NC | ||
East Tennessee Region
|
New Market | TN | ||
West TN/AR/MO/LA
|
Ripley | MO | ||
Field Office
|
Tuscola | TX | ||
Field Office
|
Hindman | KY | ||
Field Office
|
Robbinsville | NC |
GOLDEN STATE UTILITY CO.
| Division | City | State | ||
Main Office/ Division 1
|
Ceres | CA | ||
Division 2/ Selma
|
Selma | CA | ||
Division 3/ Engineering & Locates
|
Tracy | CA | ||
Division 4/ Bay Area
|
Santa Clara | CA | ||
Division 5/ Sacramento
|
Sacramento | CA | ||
Division 6/ Fontana
|
Fontana | CA | ||
Field Office
|
Santa Clara | CA | ||
Field Office
|
Los Angeles | CA | ||
Field Office
|
Sacramento | CA |
Quanta Services, Inc.
|
Attachment C | |
Facility Locations |
INFRASOURCE TELECOMMUNICATIONS SERVICES
| Division | City | State | ||
Main Office
|
Harleysville | PA | ||
INFRASOURCE UNDERGROUND
| Division | City | State | ||
Main Office/ Support Services
|
Glen Ellyn | IL | ||
Distribution Division Great Lakes Region
|
Ypsilanti | MI | ||
Atlantic Region
|
King of Prussia | PA | ||
Central Region
|
Aurora | MO | ||
Quanta Renewal Energy Services
|
Pleasanton | CA | ||
Pipeline/ Natl Business Lines Division
|
Houston | TX | ||
Field Office
|
Grand Junction | CO | ||
Field Office
|
Hialeah Gardens | FL | ||
Field Office
|
Suwanee | GA | ||
Field Office
|
Des Moines | IA | ||
Field Office
|
Monroe | LA | ||
Field Office
|
Ann Arbor | MI | ||
Field Office
|
St. Cloud | MN | ||
Field Office
|
Kansas City | MO | ||
Field Office
|
Buffalo | NY | ||
Field Office
|
Landenburg | PA | ||
Field Office
|
Cincinnati | OH | ||
Field Office
|
Sheridan | WY | ||
Field Office
|
Fredericksburg | VA | ||
Field Office
|
Souix Falls | SD | ||
Field Office
|
Saginaw | MI | ||
Field Office
|
Detriot | MI | ||
Field Office
|
Brunswick | GA | ||
Field Office
|
Erie | PA | ||
Field Office
|
Searcy | AR | ||
Field Office
|
Marion | MS | ||
Field Office
|
Prince George | VA | ||
Field Office
|
Baldwinsville | NY | ||
Field Office
|
Durango | CO |
INTERMOUNTAIN ELECTRIC, INC.
| Division | City | State | ||
Main Office
|
Aurora | CO | ||
Reno Division
|
Sparks | NV | ||
Field Office
|
Reno | NV | ||
Field Office
|
Denver | CO |
Quanta Services, Inc.
|
Attachment C | |
Facility Locations |
IRBY CONSTRUCTION COMPANY
| Division | City | State | ||
Main Office
|
Jackson | MS | ||
Field Office
|
Gibson | GA | ||
Field Office
|
Jackson | MS | ||
Field Office
|
Richland | MS | ||
Field Office
|
Kingfisher | OK | ||
Field Office
|
Dewey County | OK | ||
Field Office
|
Bastrop | TX | ||
Field Office
|
Dauphin Island | AL | ||
Field Office
|
Brawley | CA | ||
Field Office
|
Casselberry | FL | ||
Field Office
|
Barberville | FL | ||
Field Office
|
Silex | MO | ||
Field Office
|
Oakland | OK | ||
Field Office
|
Austin | TX | ||
Field Office
|
Round Top | TX | ||
Field Office
|
Brady | TX |
MANUEL BROS.
| Division | City | State | ||
Main Office
|
Grass Valley | CA | ||
Field Office
|
Pasadena | CA | ||
Field Office
|
Los Angeles | CA | ||
Field Office
|
Hayward | CA | ||
Field Office
|
Grass Valley | CA | ||
Field Office
|
Sacramento | CA | ||
Field Office
|
Port Matilda | PA |
MEARS
GROUP, INC.
| Division | City | State | ||
Main Office
|
Rosebush | MI | ||
Tech Services Division CA
|
San Ramon | CA | ||
Mears Canada Corporation
|
Nisku | Alberta | ||
Tom Allen Construction Company
|
Troy | MI | ||
Construction Division Michigan
|
Rosebush | MI | ||
HDD Division Texas
|
Houston | TX | ||
Metro Underground Services, Inc.
|
Sullivan | MO | ||
Field Office
|
Houston | TX |
Quanta Services, Inc.
|
Attachment C | |
Facility Locations |
M.J. ELECTRIC
| Division | City | State | ||
Main Office
|
Iron Mountain | MI | ||
Field Office
|
Sherwood | IL | ||
Field Office
|
Morris | IL | ||
Field Office
|
Troy | MI | ||
Field Office
|
Forest Lake | MN | ||
Field Office
|
Philadelphia | PA | ||
Field Office
|
Shoemakersville | PA | ||
Field Office
|
Solon Springs | WI | ||
Field Office
|
DePere | WI | ||
Field Office
|
Colchester | CT | ||
Field Office
|
Kingford | MI | ||
Field Office
|
Town of Stinnett | WI | ||
Field Office
|
Town of Washburn County | WI |
NORTH HOUSTON POLE LINE, LP
| Division | City | State | ||
Main Office
|
Houston | TX | ||
Distribution Electric & Gas
|
Mansfield | TX | ||
Ranger Field Services LA
|
Broussard | LA | ||
Ranger Field Services OK
|
Elk City | OK | ||
Quanta Utility Services Gas Pipeline
|
Cleburne | TX | ||
Can-Fer
|
Dallas | TX | ||
Realtime Utility Engineers
|
Madison | WI | ||
Field Office
|
Houston | TX | ||
Field Office
|
N. Little Rock | AR | ||
Field Office
|
Dallas | TX | ||
Field Office
|
Sulphur | LA | ||
Field Office
|
Cary | NC | ||
Field Office
|
Bedford | TX | ||
Field Office
|
Gonzales | LA | ||
Field Office
|
Austin | TX | ||
Field Office
|
Port Arthur | TX | ||
Field Office
|
Madison | WI | ||
Field Office
|
Shreveport | LA | ||
Field Office
|
Rhome | TX | ||
Field Office
|
Pflugerville | TX | ||
Field Office
|
Lake Charles | LA |
Quanta Services, Inc.
|
Attachment C | |
Facility Locations |
PAR ELECTRICAL CONTRACTORS, INC.
| Division | City | State | ||
Main Office
|
Kansas City | MO | ||
Ameren PowerOn
|
St. Louis | MO | ||
Computapole
|
Pleasanton | CA | ||
CA Region Los Angeles
|
Fontana | CA | ||
CA Region San Diego
|
Escondido | CA | ||
CA Region San Francisco
|
Vacaville | CA | ||
CA Region Upland
|
Upland | CA | ||
Colorado Region
|
Aurora | CO | ||
Hawaii Region
|
Kaneohe | HI | ||
IA Region Des Moines
|
Des Moines | IA | ||
IA Region Clearfield Longfellow Drilling
|
Clearfield | IA | ||
Kansas Region
|
Grantville | KS | ||
Maryland Region
|
Mountain Lake Park | MD | ||
Missouri Region
|
Clinton | MO | ||
Montana Region
|
Billings | MT | ||
Las Vegas Region
|
North Las Vegas | NV | ||
Reno Region
|
Reno | NV | ||
Ohio Region
|
Eastlake | OH | ||
Wisconsin Region
|
Wausau | WI | ||
Winco, Inc.
|
Aurora | OR | ||
Field Office
|
New Madrid | MO | ||
Field Office
|
Willoughby | OH | ||
Field Office
|
Winchester | VA | ||
Field Office
|
San Bernardino | CA | ||
Field Office
|
Milford | CT | ||
Field Office
|
Countryside | IL | ||
Field Office
|
Barton County | KS | ||
Field Office
|
Westernport | MD | ||
Field Office
|
Mesa | AZ | ||
Field Office
|
Aurora | OR | ||
Field Office
|
Lancaster County | CA | ||
Field Office
|
San Diego | CA | ||
Field Office
|
Bloomington | CA | ||
Field Office
|
Moss Landing | CA | ||
Field Office
|
Lancaster | CA | ||
Field Office
|
Pueblo West | CO | ||
Field Office
|
Lindon | UT | ||
Field Office
|
Duenweg | MO | ||
Field Office
|
Las Vegas | NV |
Quanta Services, Inc.
|
Attachment C | |
Facility Locations |
PAULEY
CONSTRUCTION, INC.
| Division | City | State | ||
Main Office
|
Phoenix | AZ | ||
Field Office
|
Chandler | AZ | ||
Field Office
|
Riverside | CA | ||
Field Office
|
San Diego | CA | ||
Field Office
|
Ontario | CA | ||
Field Office
|
El Centro | CA | ||
Field Office
|
North Palm Springs | CA | ||
Field Office
|
Santa Clarita | CA | ||
Field Office
|
Mesilla Park | NM | ||
Field Office
|
Yuma | AZ | ||
Field Office
|
Mesa | AZ | ||
Field Office
|
Paradise Valley | AZ | ||
Field Office
|
Lake Matthews | CA | ||
Field Office
|
Apple Valley | CA |
POTELCO, INC.
| Division | City | State | ||
Main Office
|
Sumner | WA | ||
Washington Region Spokane
|
Spokane | WA | ||
Allteck Line Contractors Administration
|
Langley | BC | ||
Allteck Line Contractors Crews
|
Burnaby | BC | ||
North Sky Communications
|
Vancouver | WA | ||
Field Office
|
Fife | WA | ||
Field Office
|
Bremerton | WA | ||
Field Office
|
Puyallup | WA | ||
Field Office
|
Olympia | WA | ||
Field Office
|
Redmond | WA | ||
Field Office
|
Burlington | WA | ||
Field Office
|
Bellingham | WA | ||
Field Office
|
Thorp | WA | ||
Field Office
|
Kent | WA | ||
Field Office
|
Port Townsend | WA | ||
Field Office
|
Oak Harbor | WA | ||
Field Office
|
Sherwood | OR | ||
Field Office
|
Mukilteo | WA | ||
Field Office
|
Maple Ridge | BC | ||
Field Office
|
Burnaby | BC | ||
Field Office
|
Klamath Falls | OR | ||
Field Office
|
Burns | OR | ||
Field Office
|
Redmond | OR | ||
Field Office
|
Irving | TX | ||
Field Office
|
Tacoma | WA | ||
Field Office
|
St. Louis | MO | ||
Field Office
|
Salem | OR |
Quanta Services, Inc.
|
Attachment C | |
Facility Locations |
PRO-TEL
| Division | City | State | ||
Main Office
|
Norwich | NY | ||
JT Communications
|
Camarillo | CA | ||
Field Office
|
Las Vegas | NV | ||
Field Office
|
Norwich | NY |
QUANTA TECHNOLOGY
| Division | City | State | ||
Main Office
|
Raleigh | NC | ||
Field Office
|
Oakland | CA |
QUANTA WIRELESS SOLUTIONS
| Division | City | State | ||
Lease with Expiration
|
Conyers | GA | ||
| Raritan | NJ | |||
| Richardson | TX | |||
| Union City | CA | |||
| Houston | TX | |||
| Centennial | CO |
THE RYAN COMPANY
| Division | City | State | ||
Main Office/ Eastern Communications
|
Taunton | MA | ||
Western Division
|
San Diego | CA | ||
Parkside Utility Construction
|
Johnston | RI | ||
Florida Division
|
Riverview | FL | ||
North Carolina Division
|
Cary | NC | ||
Texas Division
|
Austin | TX | ||
Field Office
|
Woburn | MA | ||
Field Office
|
Tampa | FL | ||
Field Office
|
North Kingstown | RI |
Quanta Services, Inc.
|
Attachment C | |
Facility Locations |
SPALJ CONSTRUCTION COMPANY
| Division | City | State | ||
Main Office
|
Deerwood | MN | ||
Driftwood Electrical Contractors
|
Lancaster | KY | ||
Fiber Technologies
|
Loganville | GA | ||
Harrisburg, PA (FBT)
|
Harrisburg | PA | ||
Pittsburg, PA (FBT)
|
Imperial | PA | ||
York, PA (FBT)
|
York | PA | ||
Virginia Region
|
Fredricksburg | VA | ||
Virginia Region
|
Richmond | VA | ||
Okay Construction
|
Princeton | MN | ||
Smith
|
Fergus Falls | MN | ||
Tjader & Highstrom
|
New Richmond | WI | ||
Wilson Roadbores
|
Princeton | WI | ||
Field Office
|
Santa Clarita | CA | ||
Field Office
|
Sarasota | FL | ||
Field Office
|
Macon | GA | ||
Field Office
|
Suwanee | GA | ||
Field Office
|
North Vernon | IN | ||
Field Office
|
Vincennes | IN | ||
Field Office
|
Conyers | GA | ||
Field Office
|
Statesville | NC |
SUMTER UTILITIES, INC.
| Division | City | State | ||
Main Office
|
Sumter | SC | ||
Field Office
|
Charleston | SC | ||
Field Office
|
Gadsen | AL |
TRAWICK CONSTRUCTION COMPANY
| Division | City | State | ||
Main Office/ CMI Services
|
Chipley | FL | ||
Alabama Division
|
Robertsdale | AL | ||
Georgia Division
|
Moultrie | GA | ||
Engineering Associates
|
Alpharetta | GA | ||
Field Office
|
Macon | GA | ||
Field Office
|
High Springs | FL | ||
Field Office
|
Glennville | GA | ||
Field Office
|
Broken Arrow | OK | ||
Field Office
|
Enterprise | AL |
UNDERGROUND CONSTRUCTION COMPANY
| Division | City | State | ||
Main Office
|
Benicia | CA | ||
Field Office
|
Santa Rosa | CA |
Quanta Services, Inc.
|
Attachment C | |
Facility Locations |
R.A. WAFFENSMITH & CO.
| Division | City | State | ||
Main Office
|
Franktown | CO | ||
Lease with Expiration
|
Brighton | CO |
WEST COAST COMMUNICATIONS
| Division | City | State | ||
Main Office/ VCI Telecom
|
Upland | CA | ||
Field Office
|
Sun Valley | CA | ||
Field Office
|
San Marcos | CA | ||
Field Office
|
Orange | CA | ||
Field Office
|
Gardenia | CA | ||
Field Office
|
Fontana | CA | ||
Field Office
|
Palmdale | CA | ||
Field Office
|
Bakersfield | CA |
Attachment D
Analysis of Different Types of
Work Performed by Quantas Operating Units
Analysis of Different Types of
Work Performed by Quantas Operating Units
Certain of Quantas operating units earn a majority of their revenues from one type of work;
however, numerous operating units exist that have large amounts of revenues from multiple types of
work other than the predominant type of work. We believe that this fact precludes the meaningful
segregation of the operating units on the basis of their predominant type of work, which for
purposes of this discussion is defined as revenues greater than 50% being derived from a particular
type of work.
An analysis of the operating units by predominant type of work for the twelve months ended December
31, 2008 in support of this fact indicates the following (in 000s):
| Predominant | Unrelated | Related | ||||||||||||||||||
| Revenue | Operating Unit | Revenues | Revenues | |||||||||||||||||
| Type | Revenues* | Included (a) | Excluded (b) | |||||||||||||||||
| Amount | Percent | Amount | Percent | |||||||||||||||||
Electric power
services |
$ | 2,463,965 | $ | 453,044 | 18.4 | % | $ | 144,489 | 5.9 | % | ||||||||||
Gas services |
$ | 583,351 | $ | 154,521 | 26.5 | % | $ | 355,695 | 61.0 | % | ||||||||||
Telecommunication
and cable
television network
services |
$ | 467,862 | $ | 73,220 | 15.6 | % | $ | 151,570 | 32.4 | % | ||||||||||
Ancillary services |
$ | 222,904 | $ | 56,890 | 25.5 | % | $ | 85,921 | 38.5 | % | ||||||||||
Total |
$ | 3,738,082 | $ | 737,675 | $ | 737,675 | ||||||||||||||
| * | Aggregated based on each operating units revenues by predominant type of work. | |
| (a) | This represents the aggregate amount of revenue that is earned by operating units grouped within this classification but unrelated to the predominant type of work that was used to segregate and classify Quantas operating units into each group. For example, for the twelve months ended December 31, 2008, when aggregating the operating units that derived the predominant amount of their revenues from contracting services for electric power projects, 18.4% of their aggregated revenues were not related to electric power projects. | |
| (b) | This represents the aggregate amount of revenue that is related to a particular type of work that is excluded when grouping together only those entities that derive a predominant amount of their revenues from a particular type of work. For example, for the twelve months ended December 31, 2008, when aggregating the operating units that derived the predominant amount of their revenues from contracting services for electric power projects, the amount of electric power service revenue that would not be included in this grouping, but rather, included in the other aggregations of operating units for another |
Page 1
| predominant revenue type would be 5.9% of the aggregated electric power service revenues. |
The following provides additional analysis when specifically considering certain individual
operating units for the twelve months ended December 31, 2008:
| | Of those operating units that derive the predominant amount of their revenues from electric power services, one of the operating units derived 40.2% of its revenues from gas services and another derived 25.0% of its revenues from telecommunications services. | ||
| | Of those operating units that derive the predominant amount of their revenues from gas services, one of them provided 8.0% of Quantas total reported ancillary service revenues. | ||
| | Of those operating units that derive the predominant amount of their revenues from telecommunications revenues, one of them derived 43.2% of its revenues from ancillary services and another derived 36.0% of its revenues from electric power services. | ||
| | Of those operating units that derive the predominant amount of their revenues from ancillary services, one of them derives 33.5% of its revenues from gas services and another derived 35.3% of its revenues from electric power services. |
The table below presents a comparative analysis of revenues by type of work based on the
aggregation of revenues by operating units with predominantly similar types of work against
revenues by type of work, as presented in Quantas enterprise-wide disclosures in the 2008 Form
10-K.
| Revenues by | ||||||||||||
| Predominant | Type of Work | |||||||||||
| Revenue | Operating Unit | (as publicly | ||||||||||
| Type | Revenues* | reported) | Difference | |||||||||
Electric power
services |
$ | 2,463,965 | $ | 2,155,410 | $ | 308,555 | ||||||
Gas services |
$ | 583,351 | $ | 784,525 | $ | (201,174 | ) | |||||
Telecommunication
and cable
television network
services |
$ | 467,862 | $ | 546,213 | $ | (78,351 | ) | |||||
Ancillary services |
$ | 222,904 | $ | 251,934 | $ | (29,030 | ) | |||||
Total |
$ | 3,738,082 | $ | 3,738,082 | $ | | ||||||
| * | Aggregated based on each operating units revenues by predominant type of work. |
The above analysis further illustrates how a simplified aggregation of Quantas operating units by
predominant type of work for disclosure purposes would not provide meaningful information to
investors. Management, having considered the impact of the differences
Page 2
noted above, has presented
Quantas enterprise-wide disclosures of revenues, based on the specific type of work performed, as
aggregated across all of Quantas operating units.
One important item to note is that all of the data presented in this analysis and otherwise in our
response letter has been presented for those operating units that were separately reporting
financial data as of December 31, 2008. Since then, Quanta has implemented certain reorganizations,
resulting in a slightly different operating unit reporting structure. One operating unit has been
separated into two stand-alone operating units, and two entities have been reorganized to report
under two different operating units. Lastly, another operating unit has been separated such that
different pieces of the operations report under three other different operating units. This minor
operating unit reorganization happens periodically for different reasons, as discussed below. In
2007, similar reorganizations occurred both with operations being separated as new stand-alone
operating units and with others being combined with existing operations.
The impact on the above analysis for the reorganizations that occurred in early 2009 is that an
operating unit that had historically derived the predominant amount of its revenues from ancillary
services has now been combined with an operating unit that, after the combination, derives the
predominant amount of its revenues from gas services. This combined operating unit now derives as
much as 13.6% of its revenues from ancillary services, which represents as much as 29.0% of total
ancillary service revenues in the first quarter of 2009. Another operating unit that had
historically derived the predominant amount of its revenues from ancillary services has now been
combined with an operating unit that, after the combination, derives the predominant amount of its
revenues from telecommunication services. This combined operating unit also continues to derive as
much as 37.8% of its revenues from electric power services.
These operating unit reorganizations occur periodically for different reasons, which may include:
executive turnover at an operating unit, strategic customer initiatives, acquisitions, and
operating unit performance. As a result of these reorganizations, the affected Quanta operating
unit assumes a type of work that may not have been a part of its historical operations.
Furthermore, these reorganizations indicate that an aggregation by predominant type of work would
lead to potentially frequent reclassifications from one period to another, which would render the
aggregation by predominant type of work less meaningful or comparable on a period-to-period basis.
Page 3
Attachment E
Analysis of Interchangeability of Quantas Labor
Analysis of Interchangeability of Quantas Labor
As noted in the main body of our response letter to the Staff, a substantial amount of Quantas
work shares fundamental requirements such as directional drilling, trenching, pole setting, road
building, site preparation, foundations and assembly. Much of this work does not require
specialized labor skills and as such, much of Quantas labor resources are utilized across types of
work on a regular and recurring basis. Numerous current examples of this include the following:
| | One of Quantas operating units is currently utilizing the same crews and project managers to perform telecommunications work, underground power transmission conduit/man-hole systems and airport fueling systems. This revenue is classified as telecommunications work, electric power work and ancillary work, respectively. | ||
| | One of Quantas operating units estimates that as much as 30% of its crews perform a combination of electric and gas work. In addition, the operating unit regularly has electric crews that place communications equipment for the internal communications of the utility. | ||
| | One of Quantas operating units, which predominantly derives its revenues from telecommunication services, recently submitted a bid to a customer for the construction of an electric substation, where its crews will perform approximately 40% of the work and subcontract the remaining 60% of the work to another Quanta operating unit. However, all of the work would be classified as electric power work. | ||
| | One of Quantas operating units, which predominantly derives its revenues from telecommunication services, recently submitted a bid to a customer for work that involves its crews placing all overhead utilities, including electric, telecommunication and cable underground in the same trench. The work is all being contracted through a local utility such that one bid is being submitted that covers all of the work to be performed. | ||
| | One of Quantas operating units, which predominantly derives its revenues from gas services, is performing work to install long-haul fiber optic cabling. This project is being managed and constructed by crews that have historically performed gas distribution work. This work would be classified as telecommunications work. | ||
| | One of Quantas operating units, which historically provided ancillary commercial and industrial services primarily to hospitals and manufacturing customers, is currently pursuing substantial projects associated with renewable energy. This work is currently being performed by many of the same crews that performed services for hospitals and manufacturing facilities. The services performed for renewable energy projects are classified as electric power work. | ||
| | During a recent ice storm, power lines were damaged and required replacement. One of Quantas operating units that predominantly derives its revenues from telecommunication services used its crews to remove the damaged poles and power lines. This work was classified as electric power work. | ||
| | Our joint trench work is common where one crew will dig and place conduit in a trench. This conduit may be used for electric power, gas, telecommunications or cable television. At times, the crew performing the work may not be aware of the intended use of the conduit being installed. Alternatively, if a joint trench agreement does not exist between |
Page 1
| the separate utilities, Quantas crews may install one type of line (e.g. electrical) in one trench and another type of line (e.g. data cable) in another trench on the same right-of-way. |
Additional management level examples include:
| | An operating unit that had historically performed predominantly contract services for electric power projects, now performs as much as 50% gas work with the same upper level management. | ||
| | As noted in one of the examples above, an operating unit that had historically performed predominantly ancillary services for commercial and industrial projects now performs a significant amount of work on renewable energy projects with the same upper level management. | ||
| | The management of an operating unit that had historically predominantly derived its revenues from telecommunication services is now responsible for the operations of a former stand-alone operating unit that had historically provided electric power and ancillary types of services. |
Additionally, as recently as the first quarter of 2009, the presidents of certain operating units
that derive the predominant amount of their revenues from telecommunications services met at
Quantas corporate office to discuss the additional opportunities that exist for these operating
units to perform subcontract services for other entities. Quanta management believes that one of
its competitive advantages is the size of its labor pool. As electric power transmission spending
by customers expands, both in the number and size of projects, various operating units will be
called on to perform services which allow Quanta to better leverage its combined workforce toward
obtaining and performing on these larger projects. This is a significant example of how the
operating unit by operating unit approach allows management to allocate resources at the project
level across operating units and different types of work.
All of the examples described above are recent and have occurred during the time period with which
we have been corresponding with the Staff regarding Quantas segment reporting. These examples
support our statements regarding the cross capabilities of numerous employees within Quanta. As
discussed, these examples include not only the personnel performing the day to day tasks on the
projects, but also the project management personnel and upper level management.
Page 2
Attachment F
| John Colson Chairman & CEO James Haddox Jim ONeil Tana Pool Vice President and General Counsel Chief Financial Officer President & Chief Operating Officer Wilson Yancey Derrick Jensen Ken Trawick John Wilson Director, Safety Vice President, President President Chief Accounting Officer Telecom, Cable TV Division Electric Power & Gas Division Reba Reid Nick Grindstaff Director, Communications Treasurer Various Operating Unit Presidents Various Operating Unit Presidents Ben Bosco Darren Miller Senior VP, Business Development &Outsourcing Vice President IT & Administration |